There will come a time when your client will want to know the economic impact of your work.
This should be fairly easy to settle. All you have to do is set up an A/B test. If you followed all the best design and marketing practices, the client will see an increase in revenue and conversion rates, and will be delighted with your work, right?
Not so fast…
This is exactly what I thought when I was introduced to A/B testing (it’s very similar to what almost every A/B testing pro starting out thinks).
Years ago, I was doing marketing for a blog and I made tweaks and improvements to the blog's digital product sales page. The client was curious about whether these tweaks were actually improving the conversion rate, so we decided to do an A/B test.
I was confident that my “improved” version would win because I had followed best practices. (I had evidence that it worked from other blogs that I read, and from where I got the ideas.).
Turns out, it didn't. My “improved” version lost. And, thus, my confidence was shaken and I felt like a fraud.
However, later (after digging in and learning more about A/B testing) I discovered that this is quite common. Even the most experienced designers and marketers are often proven wrong when they put their knowledge and expertise to the test (this is also why many folks in this industry dislike A/B testing; it can hurt your ego).
What's more interesting is that the results of my test were actually inaccurate (or incomplete, to be more precise). This meant that perhaps my “improved” version wasn't a loser after all. There are many ways to screw up the reliability of your results, and I managed to do just that.
Therefore, if you are planning to use A/B tests to prove how valuable your work is (your new design is better) or to settle a debate (what works best), you are likely setting yourself (and your client) up for disappointment (especially if you have never run an A/B test before).
You might also like: How A/B Testing Will Make You a Better Web Designer.
In this two part series, my aim is not to discourage you, but to help you figure out whether it actually makes sense to run an A/B test for your client. As you’ll learn, not every store is ready for one.
If the answer is yes, part two of this series will show you how to ensure you use A/B testing for the right reasons, and to get the right results.
But first, let’s dive into what you need to keep in mind before tackling the almighty A/B testing.
Theory doesn't always work the way it should in real life (that's why it's just theory)
Everything depends on context. What works for others may not work for you and your client. This applies to everything, even the most well-known and seemingly indisputable design and usability practices.
Every business is different and every customer is different — different target audience, traffic sources, devices, purchasing intents, purchasing cycles, objections, fears, prices, and so forth.
Furthermore, times change. People learn new technologies and adopt new behaviours — nothing stands still. What works today may not work tomorrow and vice versa.
This doesn't mean that best practices never work. They do, and they are a good starting point, but they are merely a guideline, not a proven and guaranteed method to boost revenue and conversions.
What this means is that relying solely on best practices and being confident that you know what works best, even if you are an expert with years of experience, is simply not a reliable testing and optimization strategy — you will be proven wrong.
Incorrect A/B testing causes huge losses for ecommerce
A/B testing is widely misunderstood and highly complex. It's one of those things that looks easy on the surface (you might feel that you know how to do it after reading a blog post), but it's really hard to master. It can take years of learning and practice.
According to research done by Qubit, poor and misused A/B testing is costing online retailers up to $13 billion per year.
It's not only that it's difficult to get wins; there are also a lot of traps that lead to misleading and invalid results. You may see that your variation is winning, so you get excited and implement it, only to find out that nothing changes or it even gets worse. More often, you'll simply get inconclusive results — no difference (which doesn't necessarily mean there really isn't a difference).
It is quite common to get imaginary results. This is also why many case studies are likely inaccurate.
This might discourage you from running A/B tests, but keep in mind that it's really the only valid method to measure the economic impact of a change, and to make sure your work is really adding monetary value to your client.
The biggest ecommerce companies, such as Amazon and Booking.com, spend an enormous amount of resources on testing and optimization (Amazon spent $6.5 billion on its optimization and testing capacity.)
And how can you get better if you don't know whether your ideas work in real life? Mistakes and real feedback allow us to get better.
What you need to know
What makes A/B testing complex is that you’re not only dealing with variables, but you also require certain prerequisites and a fair amount of technical knowledge to be able to get valid outcomes — not to mention a structured approach to ensure wins (more on than in part 2).
Now, let's look at the main things you need to know to ensure the validity of your results (and avoid inconclusive and invalid results).
1. You need a healthy number of visitors (large-enough sample size)

Let's say your clients have an average two percent ecommerce conversion rate (the percentage of traffic that converts into customers). You have an idea you want to test and you think it could improve the conversion rate by at least five percent. (This is called a minimum detectable effect).
In order to reach statistical significance (an important indicator that the result is not random), you will need 309,928 visitors per variation. That's 619,856 visitors for one A/B test (the necessary sample size) to be able to detect whether the result is statistically valid.
However, if you have the same two percent conversion rate, and you shoot for a 20 percent lift, you'll need just 19,784 visitors per variation.
That’s because statistically it's easier to call to big winners. If the conversion rate itself is higher than two percent, you'll need fewer visitors as well (four percent conversion rate with a five percent lift = 151,776 visitors per variation).
You might be thinking, “Then I'll just shoot for a 20 percent lift” (or, “Why not a 50 — 100 percent lift or more?”). While 20 percent is realistic, it's almost impossible for you to predict the outcome, especially when you don't have much testing experience and you don't have a clear understanding of what type of changes could potentially lead to a 20 percent difference.
What happens when you ignore this and just run the tests?
You'll get a lot of inconclusive results and you won't be able to tell whether your changes made any difference at all (e.g. maybe there is a 5 percent lift, maybe not, but you need 200,000 more visitors to reach statistical significance).
That's why it is important to calculate the necessary sample size before every A/B test. There are various sample size calculators available made specifically for A/B testing. My go-to tool is evanmiller.org/ab-testing/sample-size:

Or, if you find this one confusing, just google “A/B test sample size calculator.” Every popular A/B testing tool has its own.
Just a heads up, most of your clients probably have fewer than 619,856 monthly visitors and this doesn't mean you can't run A/B tests. You can and you should. Just know that you won't be able to test every small change, and that you will have to be more deliberate about every test.
The conversion rate is higher when closer to checkout; and the expected lift (minimum detectable effect) is higher when you are testing bigger changes (more on that later in this article) therefore, you can probably test their cart page or product page.
But it's not just traffic; you need a healthy number of purchases as well.A lot of folks forget this, but if your client's store gets fewer than 100 purchases per month on average, you will have a hard time running A/B tests.
That’s because purchases (transactions) are still your sample size, not just the traffic. How many purchases do you need? Sometimes 250 purchases per variation is enough, but more often you'll need 500 or more. There is no magic number. It depends on the test, but the more purchases you have, the more confident you can be in the data.
If you have a small sample size, your purchases may not be represented equally and accurately. You can get lucky with some shoppers by pure chance, and the result may even appear statistically significant.
If you keep the test running for longer, there's a high chance that the statistical significance will disappear.
Which brings me to my next point …
2. You need a basic understanding of the statistics behind A/B tests

This is the part where you can really geek out…or it can confuse the heck out of you. It depends on your relationship with math.
This may seem simple, as most of the A/B testing tools do the complex math for you, but the truth is, it's far from simple. If you ignore this part, the risk of getting imaginary results increases significantly.
Thus far, I’ve mentioned terms like sample size (how much traffic you need) and minimum detectable effect (the lift you are shooting for). I’ve also mentioned the term statistical significance (which means the result is likely not due to chance), but there are more terms that come into play.
P-value
When reading about statistical significance, you will see this term thrown around. It's kinda hard to explain what it is exactly.
It's the probability of obtaining a result equal to or "more extreme" than what was actually observed, when the null hypothesis is true.
Confusing, right? In short, data scientists use the p-value to determine the level of statistical significance.
"In short, data scientists use the p-value to determine the level of statistical significance."
The A/B testing tool takes your test data, calculates the p-value, and then subtracts it from one to give you the level of statistical significance.
Say you have a p-value of 0.04, so 1 - 0.04 = 0.96. You have a 96 percent significance. (Note that many tools convey statistical significance as statistical confidence).
If your level is 95 percent and above (or the p-value is 0.05 and below), the result is statistically significant.
In other words, you can assume that the probability that the results are due to chance (or a fluke) is low enough for you to accept the test result.
However, this does not tell you whether B is better than A. It also doesn't tell you that it's time to stop the test. Statistical significance tells you only whether there is a statistically significant difference between B and A.
Why 95 percent? Why not 90 percent?
Ninety-five percent is a generally accepted industry-wide threshold (a standard that comes from the academic world). Anything close (below 95 percent) is considered marginal, greatly increasing the chance of inaccuracy in your results.
Statistical power
This is not the same as significance, although it sounds very similar and, yes, they are closely connected. It's the opposite. Statistical significance tells you the probability of seeing an effect where there is none, while power tells you the probability of seeing an effect where there is one.
You want to avoid getting inconclusive test results because they don't tell you anything and are a waste of time.
So statistical power measures how often you will reach statistical significance if any exists.
This is something you pay attention to when calculating your sample size and planning your test:
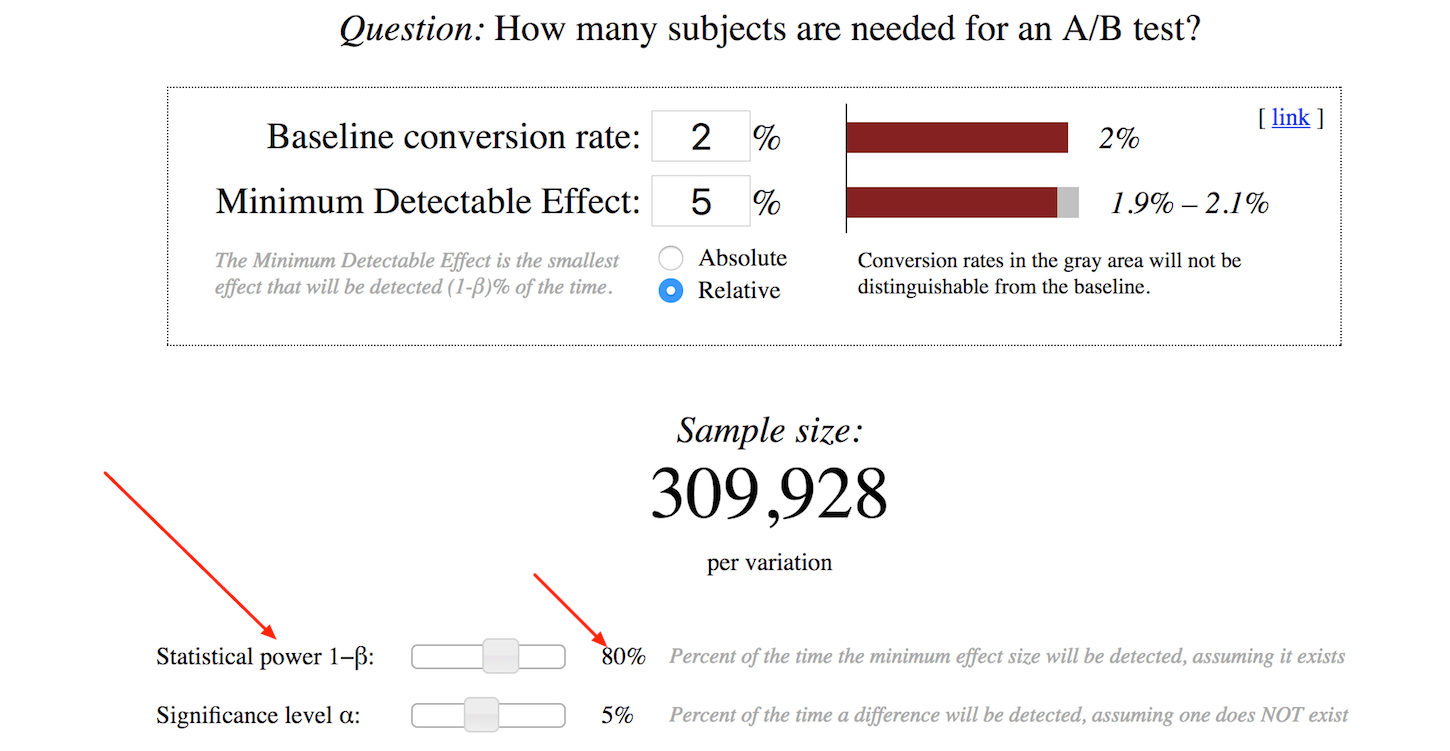
It's determined by the size of the effect you want to detect (the lift you are shooting for) and the size of the sample you use.
If you have the 2 percent ecommerce conversion rate, you shoot for a 5 percent lift, and you have significantly less than the 619,856 visitors, but you run the A/B test anyway — you are running an underpowered test.
Which isn’t a great idea because your chances of recognizing a winner are very low (which doesn't mean that there isn't a winner, just that you won't be able to detect it).
Just like 95 percent for statistical significance, 80 percent power is the industry-wide standard.
Confidence intervals (margin of error)
You may look at a test result and see that B is outperforming A by 15 percent, with 95 percent statistical significance. This may seem like great news, but it's not the full story.
In your test reports, you shouldn't see conversion rate as one constant value but actually as a range of values, because it's just an estimate of the true conversion rate (B can't tell you the true conversion rate because it doesn't represent all your traffic; it gives you an estimation).
This range of values is called confidence interval. Along with that, you'll see the reliability of those estimates — the margin of error.
This shouldn't be ignored, as it's another opportunity for you to pick an imaginary winner.
This is much easier to digest if you look at a real example:
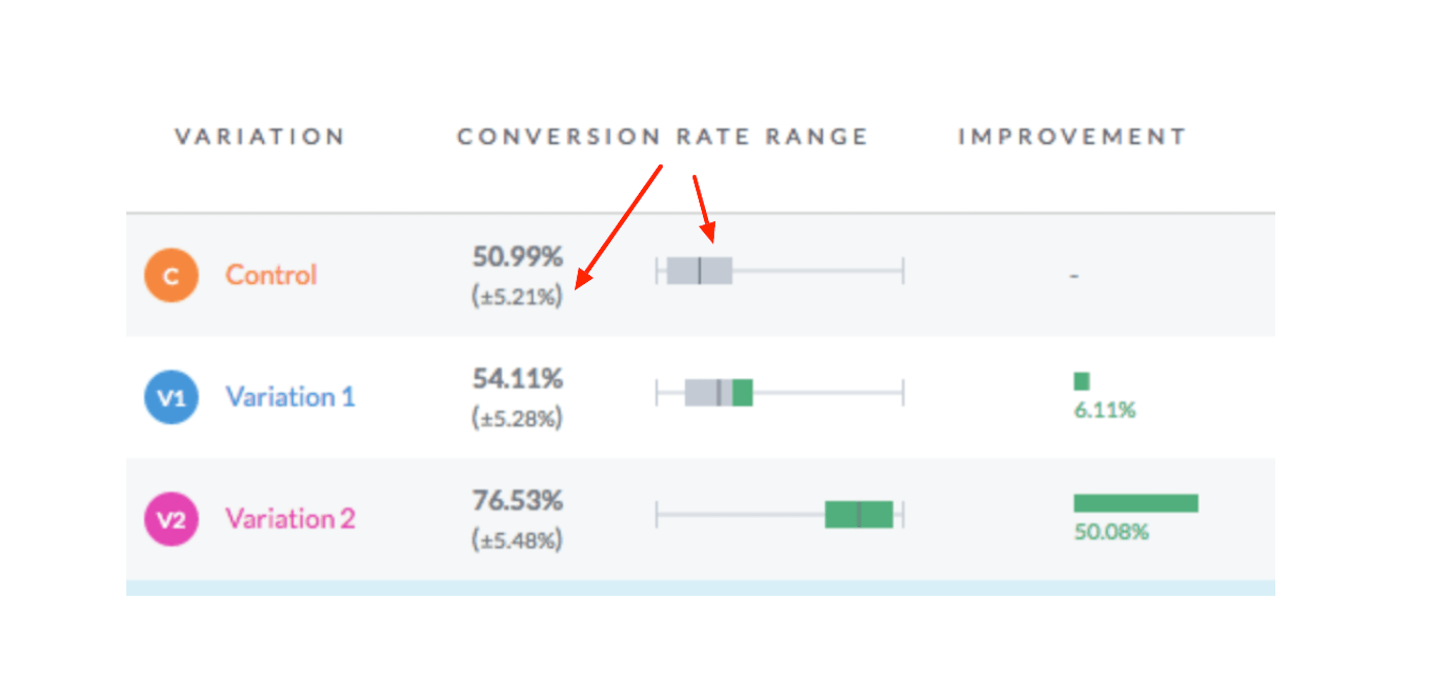
In the image above, you see that the margin of error is “+\- 5.28%”.
What this means is that the actual conversion rate for variation one could be as low as 48.45 percent (54.11 percent - 5.28 percent) or as high as 59.39 percent (54.11 percent + 5.28 percent). The average is 54.11%. The real conversion rate lies somewhere within this range.
Okay, so what?
If you see that there's a big overlap between the range of Control and Variation — as demonstrated below:
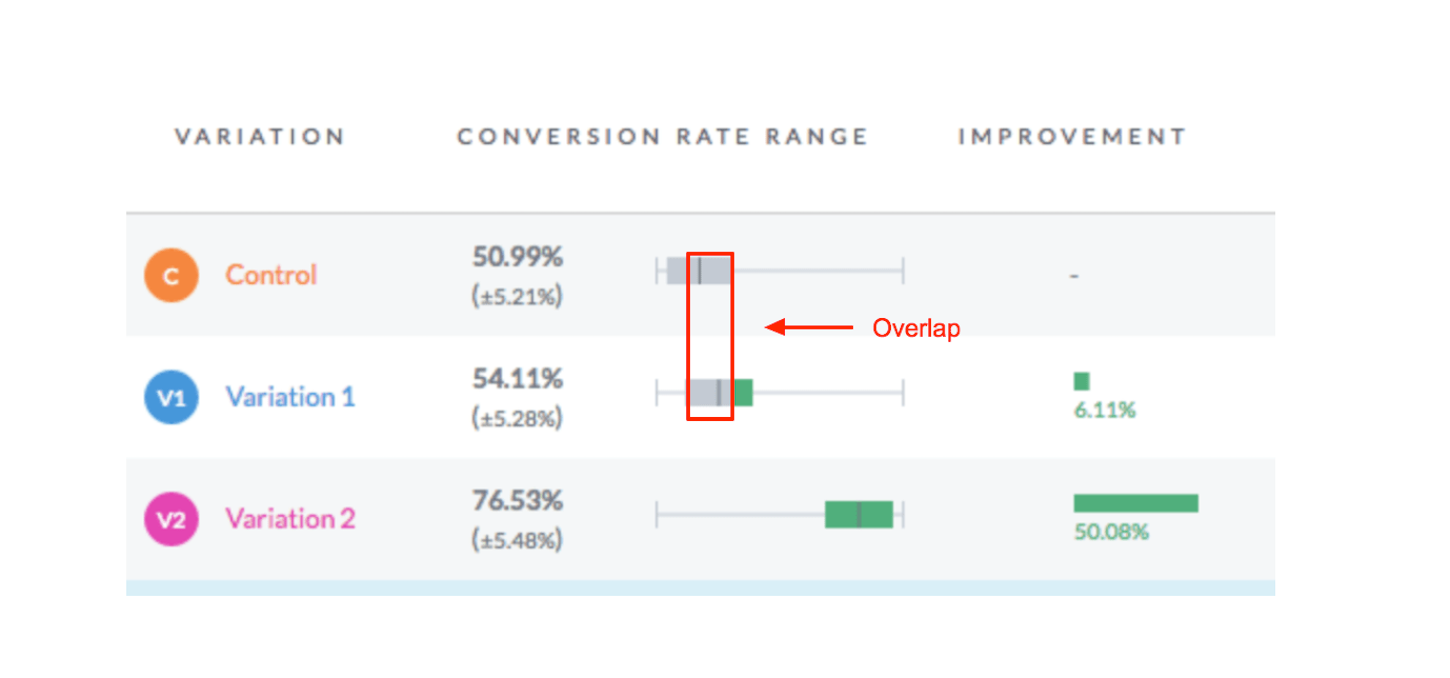
It means the test is not over yet and could go either way, even if the software reports this as a statistically significant result.
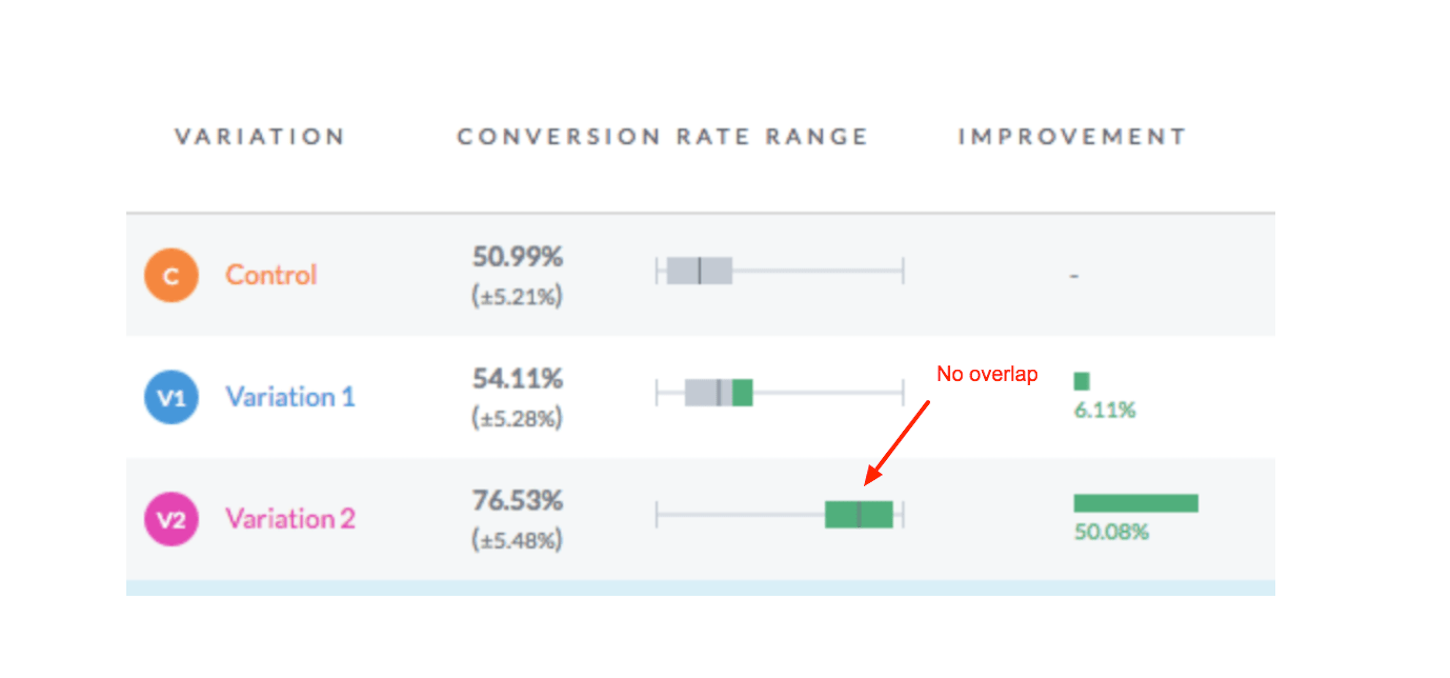
On the flip side, if there's no overlap (or very little), that's a good thing:
Bayesian or Frequentist stats
There are also two statistical schools: Bayesian and Frequentist statistics.
Both essentially help you answer the same question: Which variation performed best in an A/B test?
However, there are fundamental differences in terms of how they perform their calculations. For example, there is no p-value in Bayesian statistics. There's just the probability of B being better than A.
For a non-statistician, Bayesian statistics can be easier to digest, allowing you to describe the results in a more intuitive way.
However, frequentist statistics are most often used by A/B testing tools, in part because frequentist calculations require less computing resources.
Why do you need to know these?
Every A/B testing tool has its own stats engine — ways it calculates statistics and reports results (This is one of the primary ways they try to compete). Depending on which statistics school the stat engine is based on, it will report test results slightly differently.
What the differences are, and which one is better, are very complex topics. If you are interested, you can take a deeper dive by reading these articles:
- Bayesian vs Frequentist A/B Testing – What’s the Difference?
- Common misunderstanding of ‘Frequentist vs Bayesian approach to A/B testing’ debate?
- Bayesian vs Frequentist Statistics
However, it's not as important as it may look.
Being aware of what these methods are simply helps you understand and communicate your results better. (Remember the p-value? And what it is exactly?)
All the tools can get the job done, but there's been a trend lately towards more and more tools shifting to Bayesian statistics because it's more suited to the business world, as opposed to the Frequentist approach, which is more suited to the science world.
These terms are not easy to understand, so they are often misunderstood or completely ignored by experienced designers, marketers, entrepreneurs, and even A/B testing “experts.”
This was just a very brief intro, the tip of the iceberg. If you want to take a deeper dive (which I advise you do), these articles are good starting points:
- A/B Testing Statistics: An Intuitive Guide For Non-Mathematicians
- Understanding ab testing statistics to get real lift in conversions
- Ignorant No More: Crash Course on A/B Testing Statistics
3. It's not just statistics that ensure the validity of your results

Statistics are just numbers and formulas, they’re not the whole picture. Here are a few more factors to keep in mind when running A/B tests.
Timing
By far one of the biggest mistakes A/B testing practitioners make is stopping a test once it has reached significance.
Imagine a situation in which you come up with an idea and want that idea to win. One day you log in and see that your idea has reached statistical significance. You will be very tempted to stop the test and call it a winner (This is called peeking bias; we are all humans and it happens to all of us).
However, it would be a serious mistake because statistical significance can appear and disappear, especially in the first days of a test.
It’s just a formula. If you have the right numbers (a high volume of traffic), you can reach significance quickly, but that doesn’t mean there really is significance.
What you need to do is pre-calculate your sample size and determine how much time you'll need to reach statistical significance.
If it's just a few days, run your test longer — a full seven-day week at a minimum (though ideally two weeks to be more confident). Go through two business cycles until you have sufficient data (You can be more or less certain that each sample represents your whole traffic closely enough).
That’s because your client's conversion rate changes throughout the week. You can check your analytics and see a difference every day. There's likely a trend — e.g. you see higher conversion on weekends than on working days, so you need to take that into account when running A/B tests.
However, if you run your test longer than that, you are risking sample pollution. This is when your sample size is not distributed equally.
Also be aware of outside factors — a holiday that’s coming up, special promotions, something happening in your client's industry that's outside your control (e.g. seasonality, breaking news). These are situations in which visitors are more inclined to act differently from what they normally do.
You might also like: Split-Testing: How to Run a Revenue-Driven Test in Shopify.
Bugs
Whenever you interfere with your site's code, there's a high chance that something will get messed up.
It's not uncommon to set up an A/B test, run it for two weeks, and declare that the variation lost, only to find out later that it was due to a bug (Visitors could not complete the key task because your site simply wasn't working).
Or, the goal tracking wasn't set up properly and therefore you missed a lot of conversions.
To avoid that, you need a rigorous QA (Quality Assurance) process before every test. Make sure everything works on every browser, every device, and every variation of your site (e.g. bilingual) and that all the important data matches.
If this is too much of a hassle (which it is, I get it), you can always segment your test. Don't want to deal with IE? Keep it out of the test. However, this really depends on your client’s circumstances — you may need all the browsers because the client has traffic issues.
And, yes, this requires technical knowledge, which leads me to my next point…
4. You will need to get dirty with code
It's relatively easy to change your headline or a button color using an A/B testing tool WYSIWYG editor, but those changes won't do much for your client's business (unless you are running tests on a super-high-traffic site).
Those fall into the category of expected 5 percent lift and below (It’s way below in reality; a button color may bring you a 0.002 percent lift, you can put that into the sample size calculator and see how much traffic you'll need).
Don't get me wrong; this doesn't mean small changes can't bring you a significant result. They can, but more often than not, they won't.
If you want to run more meaningful tests that produce results for your client's business, you have to remember this simple rule:
"The bigger the change, the higher the likelihood that it will affect visitor behaviour or perception; thus, you will see a significant difference."
The bigger the change, the higher the likelihood that it will affect visitor behaviour or perception; thus, you will see a significant difference.
Unfortunately, nine times out of 10 this also means changes to your code that more often will exceed the limitations of the WYSIWYG editor.
So, if you are not very technical, you'll most likely need help. For those of you who are fairly technical, here are some good posts about several methods for setting up A/B tests in Shopify:
- A Short Tutorial for Running A/B Tests in Shopify with Optimizely
- Split-Testing: How to Run a Revenue-Driven Test in Shopify
What qualifies as a big-enough change?
In short, the change should be big enough to move the needle, and make a noticeable difference. It’s big enough to impact a visitor’s decision making — their decision about whether to become your client's customer (or to do what you want them to do).
It's not exactly a redesign of your whole store, which is also technically a big change, but in this case is way too big. It has its place and purpose. It makes more sense when the design of your store is heavily outdated and the performance is terrible, or when you are taking a new direction with your client’s brand; but you have to be careful with this one.
What I mean here is called innovative testing (sometimes radical testing). For an ecommerce client, it's fundamental changes to the key funnel pages (like the homepage, category, product, search results, and checkout), sitewide (e.g., navigation, visitor flow), and value proposition.
What about iterative (sometimes called incremental) testing? Where you test small-scale changes quickly, and then combine the winning changes to improve the site incrementally.
Yes, this allows you to be more scientific — learn more details about visitors, their behavior, and which elements convert best for your client. And you can implement the tests much faster. However, this requires a huge volume of traffic.
When it comes to delivering results to your clients, your best bet is probably innovative testing.
Go out and get some real life experience!
In the beginning of this post I mentioned that A/B testing is not something you can learn by reading a blog post, it still holds true — you will likely make mistakes, even after reading this (the same mistakes I warned you about: insufficient sample size, stopping tests too early, ignoring confidence intervals, and more) but there is no substitute for real life experience, so I hope you are not discouraged.
All the things I mentioned above are much more easier to digest when you've actually run some A/B tests. And it's an incredibly powerful thing to have in your arsenal, because it allows you to measure and actually add real monetary value to your client’s business (and thus command higher fees).
This post should put you ahead of most beginner testers, and avoid unpleasant surprises and over-optimistic promises to clients. Stay tuned for part two of this A/B testing series, where we'll cover how to give realistic promises to clients, and then delight them by over delivering.
Read more
- Free Industry Report] The Future of the Fashion and Apparel Industry
- Free Industry Report] The Opportunities, Threats, and Future of the Consumer Electronics Industry
- Teaching Code: A Getting Started Guide
- Tips and Tricks for Managing Remote Employees
- 5 Ways to Ensure Your Client's Online Business is Tax Compliant
- 9 Best CRM Software For Designers in 2022
- Go Back to School With These Online Courses for Continuous Learning
Have you ran A/B tests for clients in the past? What kind of lessons did you learn? Let us know in the comments below!

